Synthetic Aperture Radar Simulation Utility
Project Overview:
The Synthetic Aperture Radar (SAR) Simulation Utility is designed to facilitate the simulation and analysis of SAR data. The tool aims to accelerate achieved simulations by utilizing parallelization on a cluster using SLURM scheduling. The tool also runs a reconstruction algorithm to create a SAR image from the simulated data.
Before building this workflow at Remcom, it was not known whether or not the ray tracing engine could be used to simulate SAR data. The utility was built to test the capabilities of the ray tracing engine and to provide a platform for future SAR research.
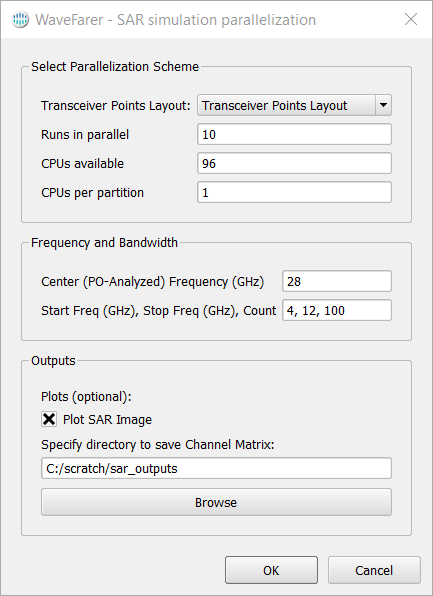 Figure 1: The SAR Simulation Utility UI. Usually in SAR arrays there are a multitude of TX/RX elements. The user can specify the parallelization scheme to maximize simulation efficiency. Additionally, the user may plot the resulting SAR image after reconstruction.
Recreating SAR images from previous publications:
In order to test if Remcom’s ray tracing engine could be used to simulate SAR data, I recreated the SAR images from a previous publication. The images were generated using the same parameters as the original paper, and the results were compared to ensure accuracy.
link to the paper
link to my post on LinkedIn
We demonstrated success in imaging and reconstruction of a simple torso. I also confirmed that the point spread function of the array was near the nominal/analytical resolution expected by the backpropagation algorithm (3.75 mm analytical vs 4 mm achieved).
The array operates at 80 GHz and is shaped like a plus sign with 250 Rx (+/- x axis) and 250 Tx elements (+/- y axis). Each element is spaced 2 mm from each other and 0.5 m away from the object. The size of the array is 0.5 m in x and y.
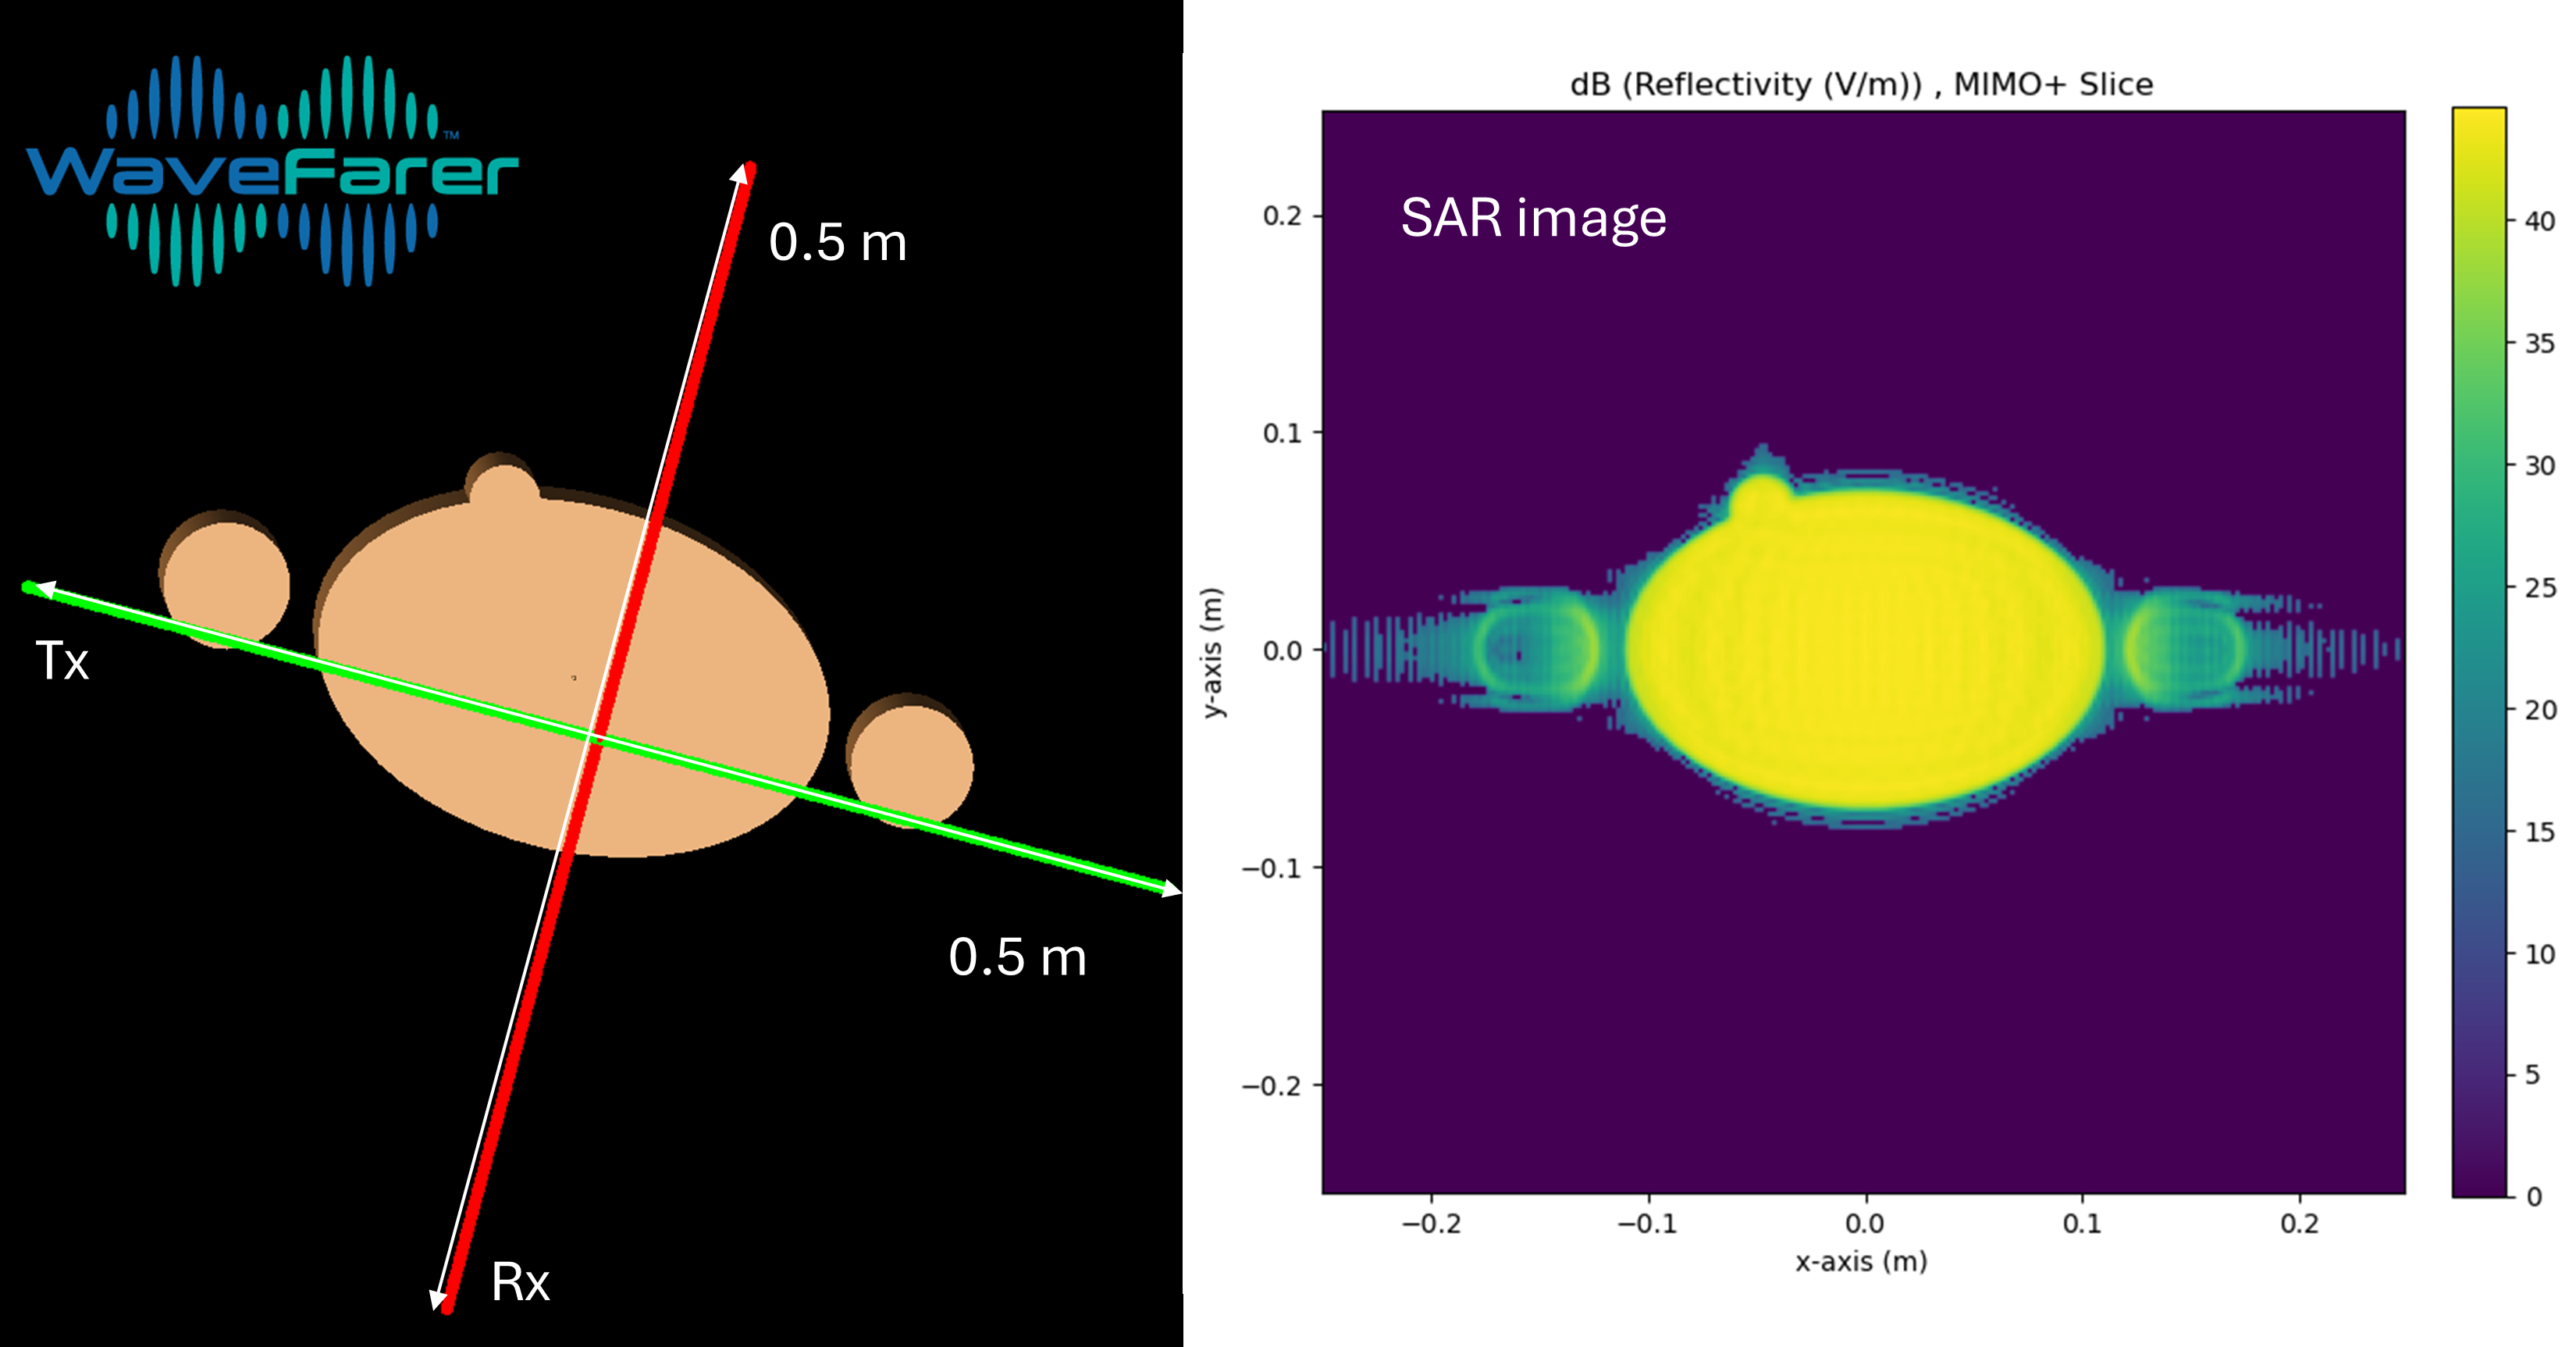 Figure 2: The torso shape was simulated in Remcom’s ray tracer and the corresponding single frequency reconstructed image was plotted on a dB scale.
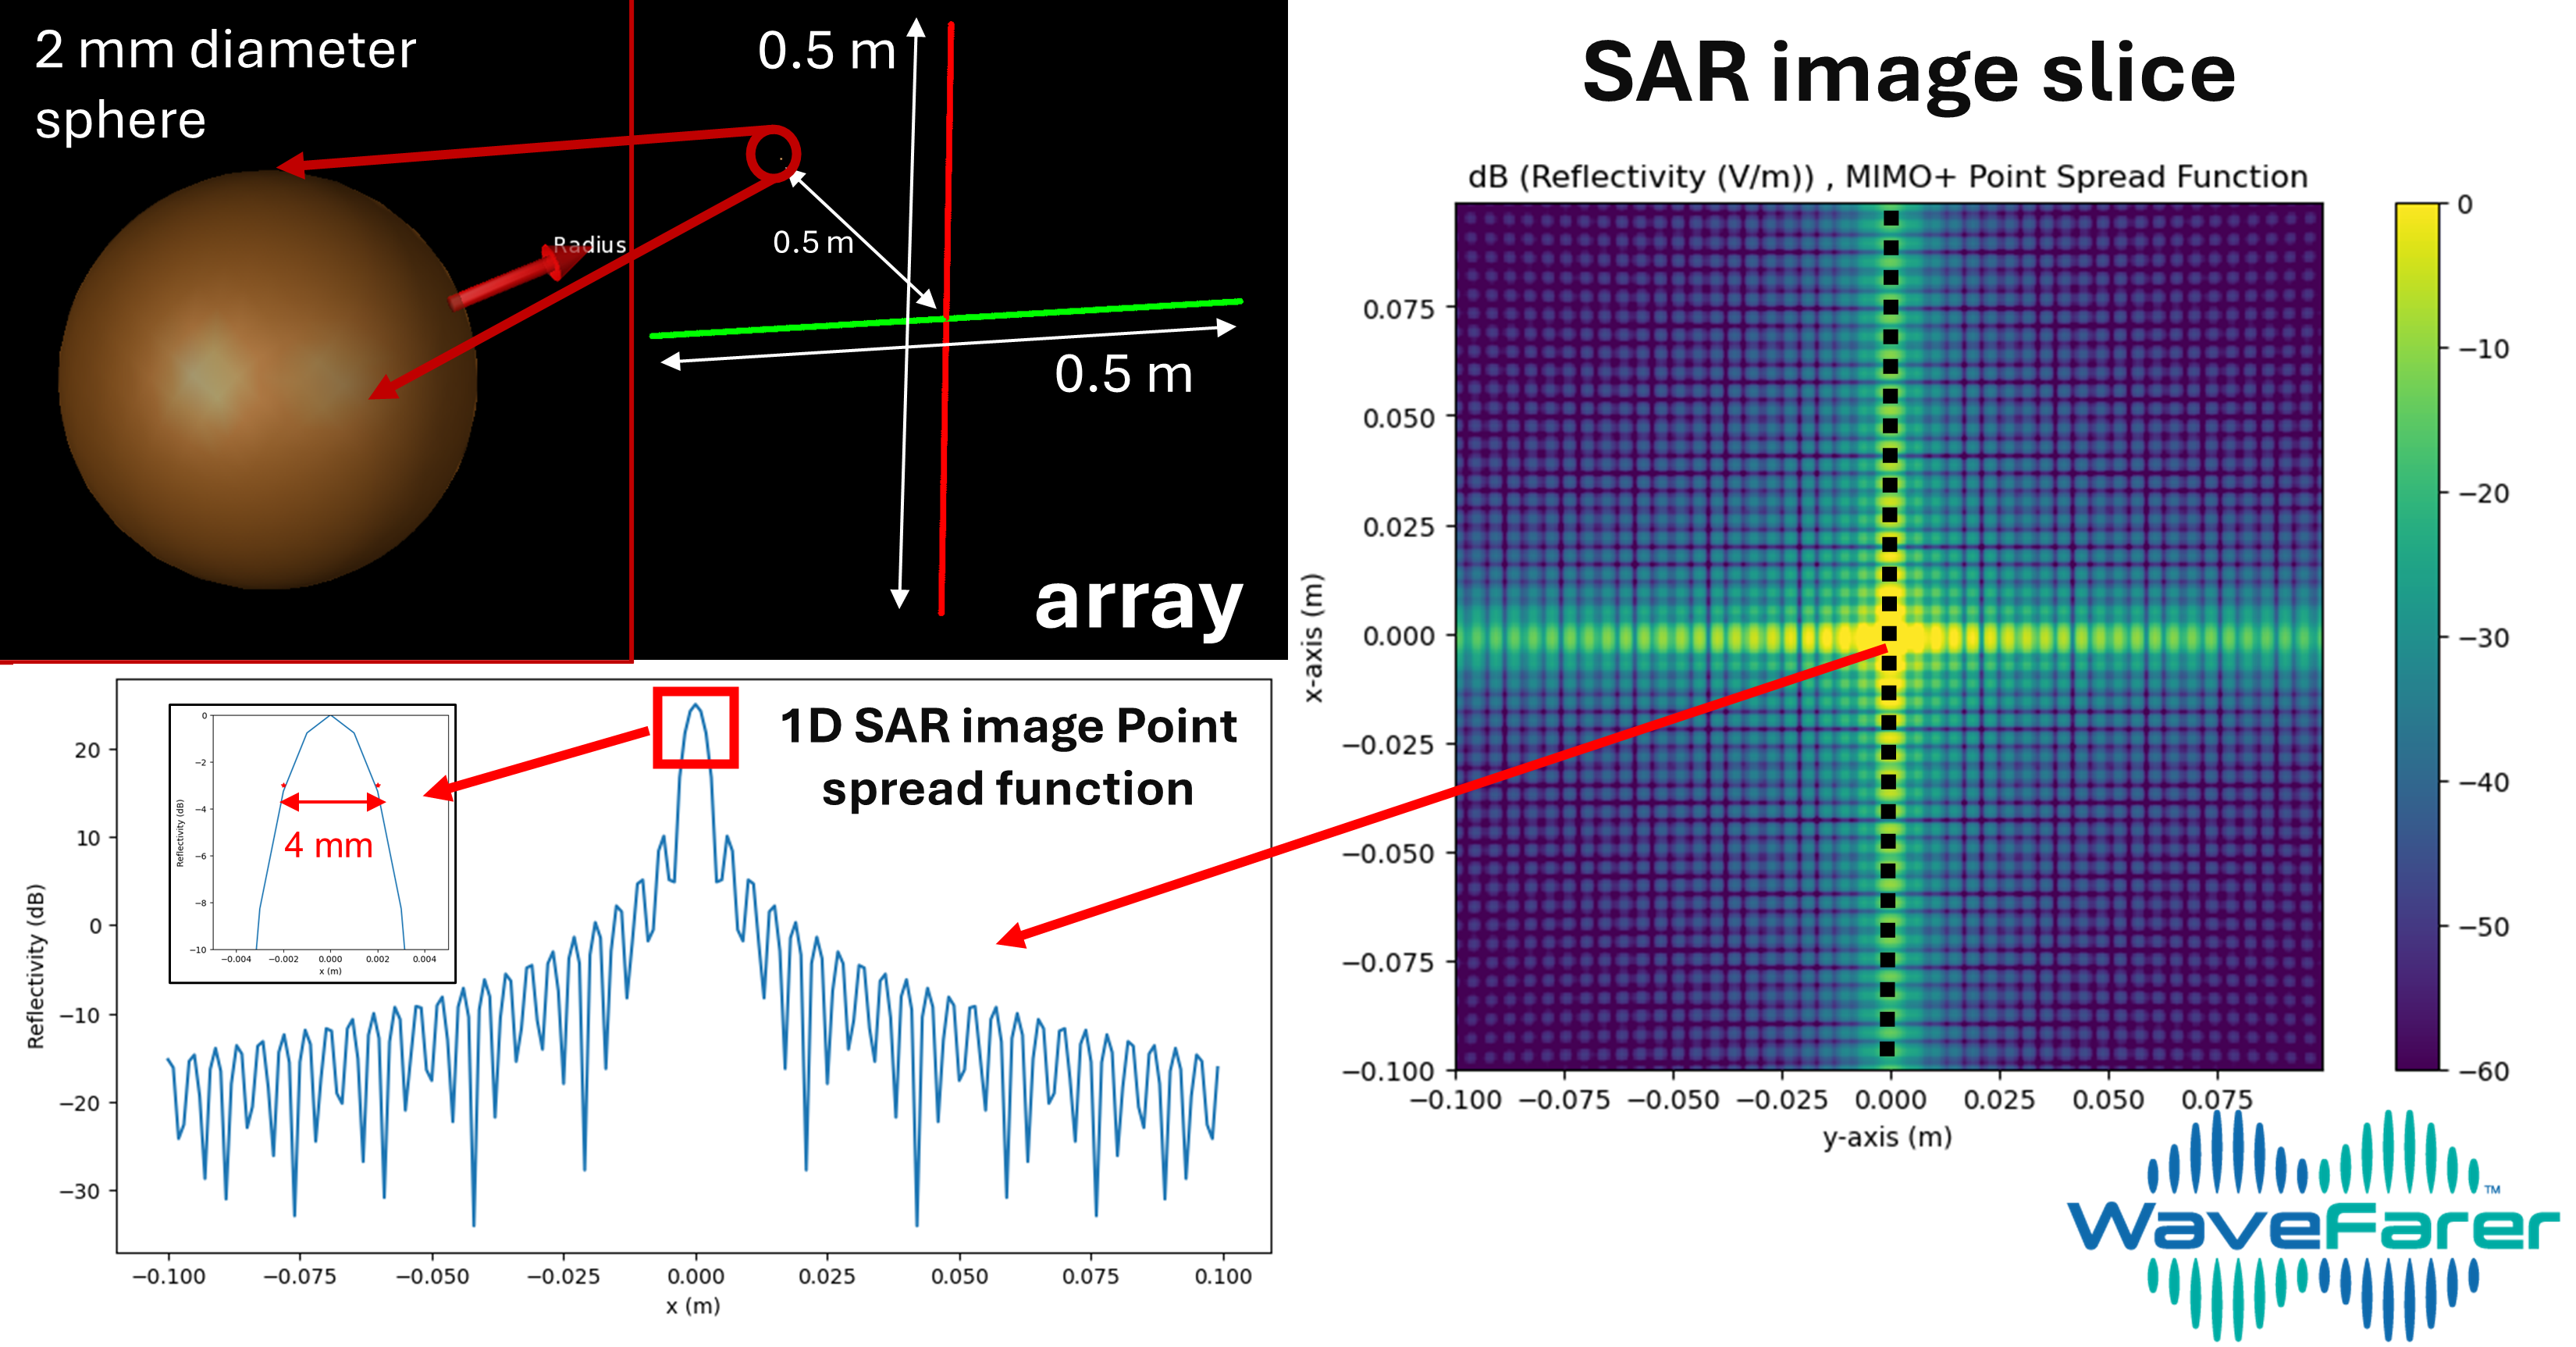 Figure 3: the point spread function measurement (PSF) of a sphere with 1 mm radius, 0.5 m away from the array centered at x=0, y=0. After reconstructing the image, we expect the sphere to be in the center of the slice. The resulting image’s peak reflectivity corresponds to the sphere, and it’s estimated size is 4 mm across. This is larger than the actual size of the sphere but near the theoretical limit of the measurement method itself (3.75 mm).
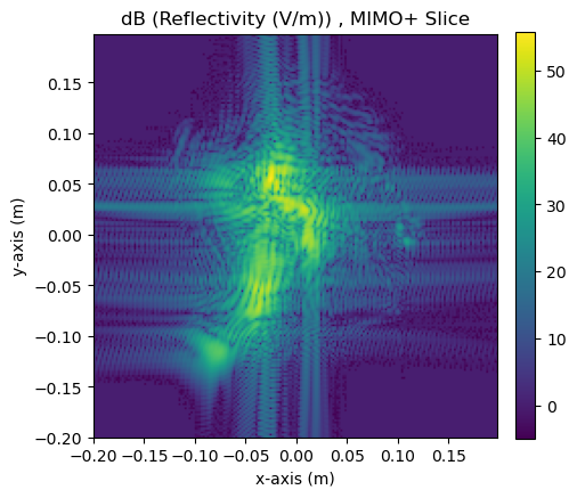 Figure 4: The side profile of a more detailed human head model was placed in front of the array to test if the array could resolve more detailed features.
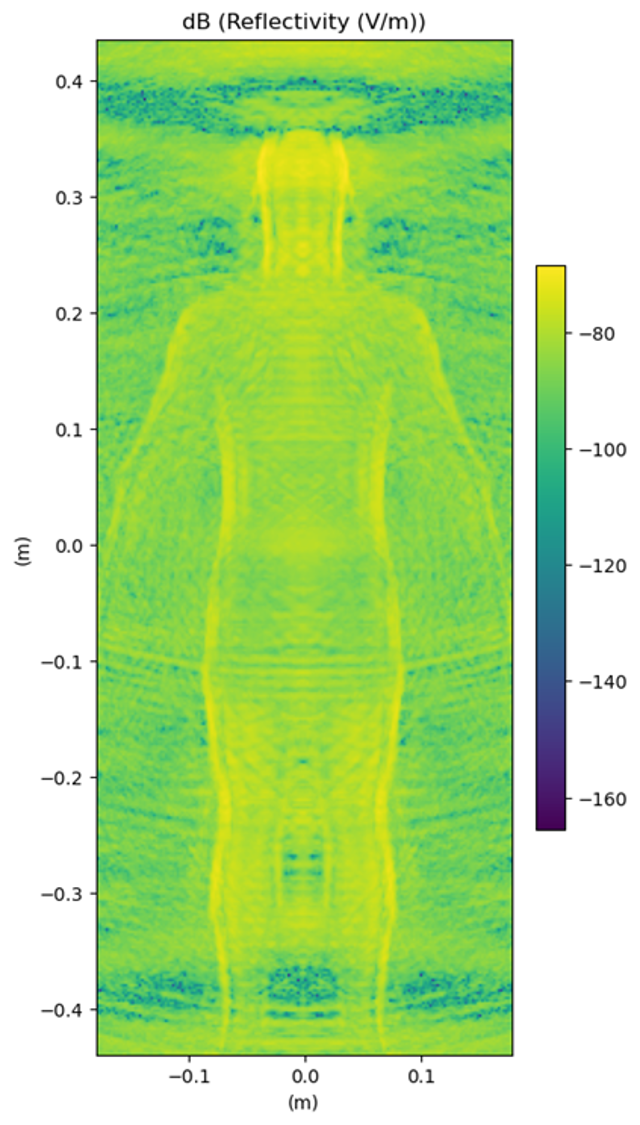 Figure 5: A larger array was used to capture a human silhouette.