Cash Flow Visualization (Sankey Budget App)
Overview
A budget web application that visualizes cash flow as a Sankey diagram: income flows into expense categories so you can see where your money goes at a glance. The app supports uploading transaction CSV files, filtering by month, and saving or restoring your data for later.
Features
- Upload transaction CSV(s) — Drag and drop or browse; supports multiple files (e.g. bank exports).
- Filter by month — Focus on a single month or view all data.
- Sankey diagram — Cash flow from income to expense categories (Rent/Mortgage, Food & Dining, Transportation, Utilities, Shopping, Subscriptions, etc.).
- Summary stats — Total expenses, total income, and net balance.
- Save & load — Download all data as JSON and restore from a saved file later.
- Sample data — Try it without uploading your own data.
Tech stack: Python, Streamlit. The app runs locally; a live demo or GitHub repo link can be added here when deployed.
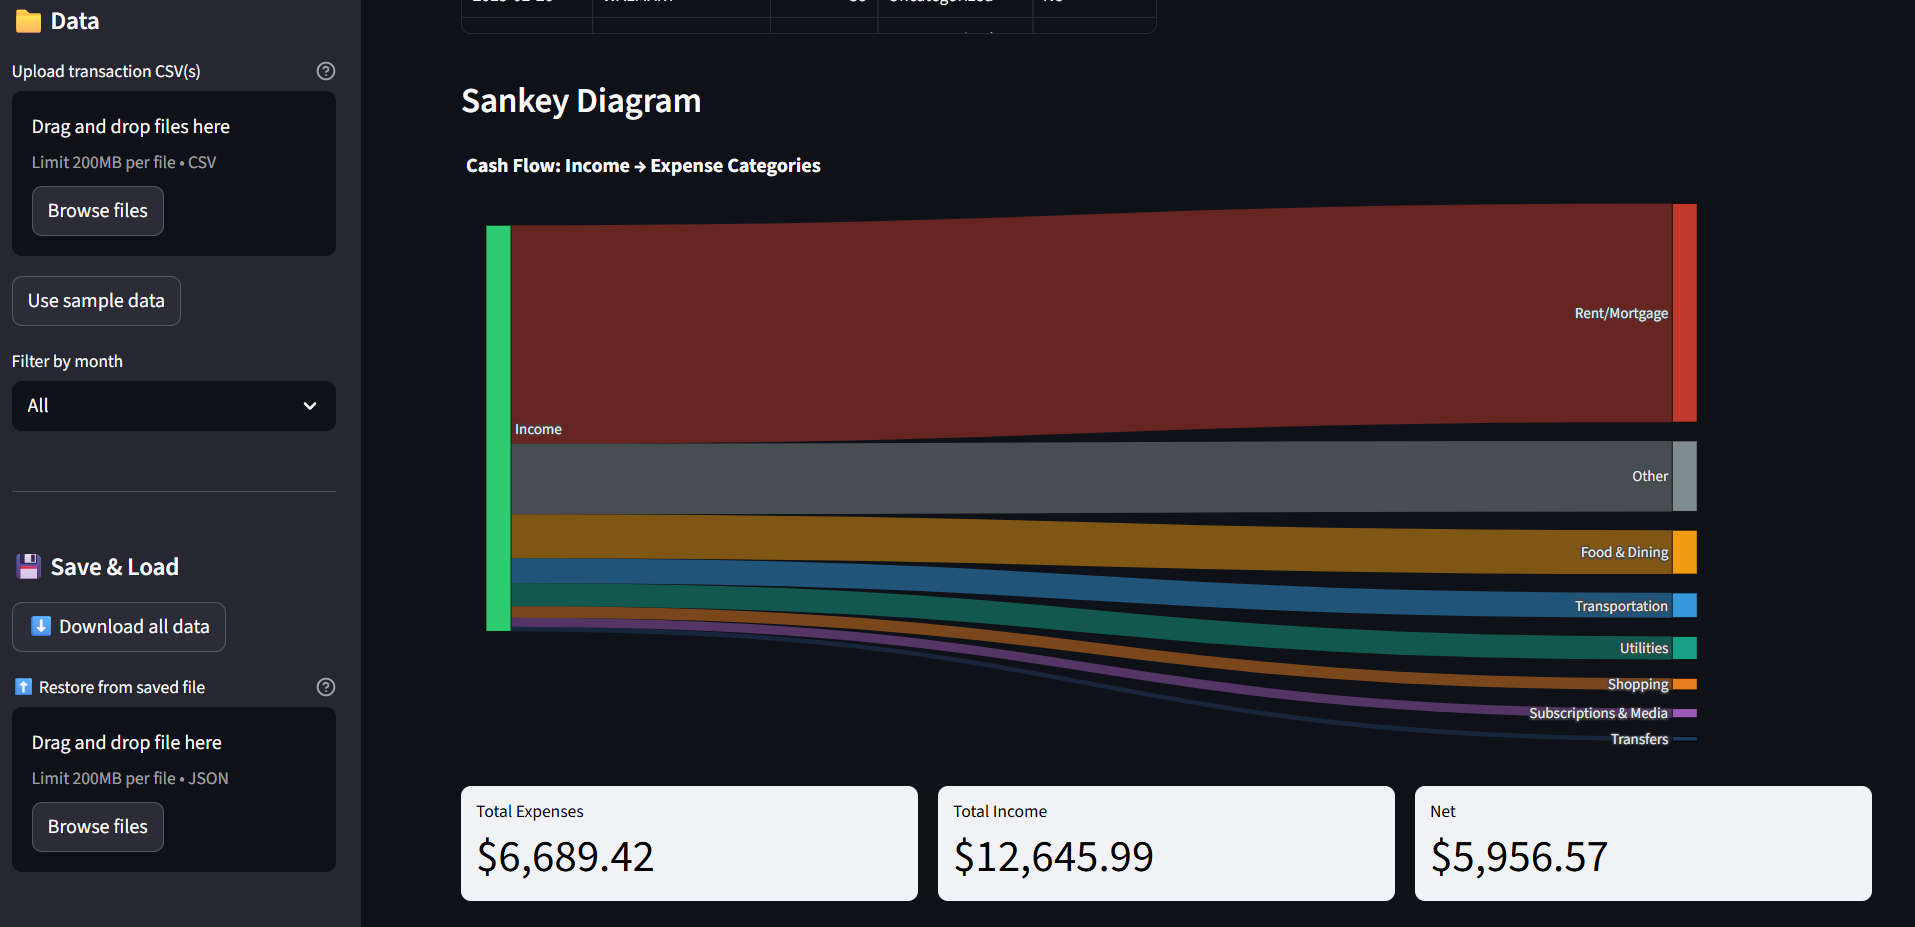 Sankey diagram view — income flows into expense categories. Dark theme with upload, filter, and save/load in the sidebar.